
Day traders always hunt for tools that reveal buying and selling pressure in the market. The Elder Ray Index stands out here, measuring these forces by mixing price action with indicators.
It lets traders see if bulls or bears have the upper hand, which honestly can make for smarter trading decisions.
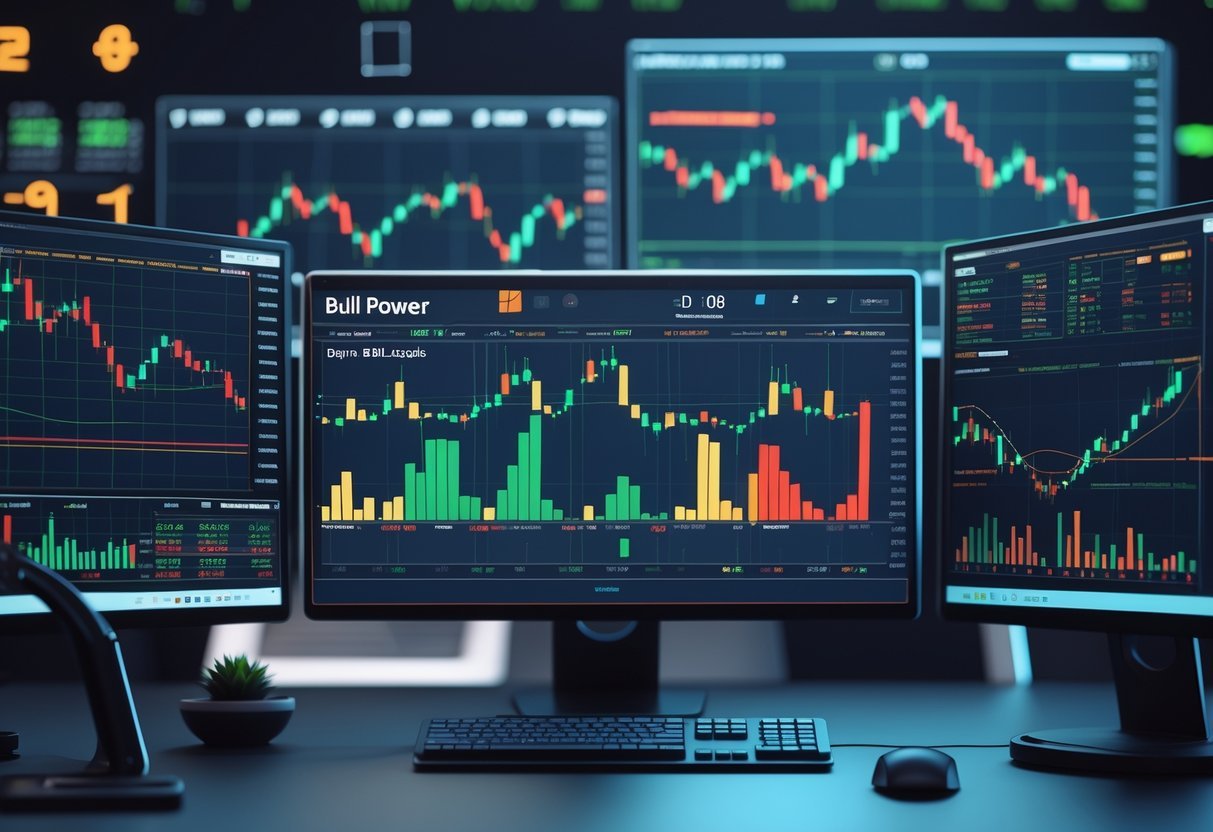
You’ll find two main parts in this index: Bull Power and Bear Power.
These parts break down the strength of buyers and sellers separately, giving a much clearer picture than a lot of other indicators out there.
Traders lean on this insight to time their entries and exits a bit better.
Learning to read the Elder Ray Index can boost your ability to spot trends or reversals pretty quickly.
It’s a handy addition for anyone serious about day trading.
Key Takeaways
- The Elder Ray Index highlights the strength of buyers and sellers in the market.
- It helps traders spot potential trend changes and confirm signals.
- Using the index can sharpen your timing for entering and exiting trades.
Understanding the Elder Ray Index in Day Trading
The Elder Ray Index gives traders a way to measure buying and selling pressure.
It uses specific price data to show if bulls or bears are winning on any given day.
This tool can guide decisions in fast-moving markets.
Definition and Importance
Traders use the Elder Ray Index as a technical analysis tool to gauge market strength.
It looks at bulls and bears separately by comparing prices to a moving average.
This approach helps traders figure out who’s in control.
It shows bull power and bear power.
Bull power measures the difference between the high price and an exponential moving average (EMA).
Bear power measures the difference between the low price and the same EMA.
If bull power is positive, buyers are strong; if bear power is negative, sellers are dominating.
The index gives clear entry and exit signals.
It helps traders avoid false moves by focusing on both sides of market pressure.
Origins and Development
Dr. Alexander Elder, a professional trader and author, created the Elder Ray Index.
He wanted a tool that would improve trading accuracy by comparing bulls and bears directly.
Elder introduced this indicator in his books and seminars to help day traders spot real trends.
He blended moving averages with candlestick price data, making it effective for short-term trading.
He designed the tool to be simple but powerful.
By separating buying and selling forces, traders get a clearer view of market conditions than with many other indicators.
Key Components Overview
You’ll find two key parts in the Elder Ray Index: Bull Power and Bear Power.
Both use the exponential moving average (EMA) as a base.
- Bull Power = High price – EMA
- Bear Power = Low price – EMA
If Bull Power sits above zero, buyers are pushing prices higher.
If Bear Power drops below zero, sellers are forcing prices down.
Traders watch these values to decide when to buy or sell.
For example, Bull Power rising above zero can be a buy signal.
Bear Power falling below zero may point to selling pressure.
This indicator works best with other tools, like volume or trend analysis, to confirm what’s happening in the market.
Components of the Elder Ray Index
The Elder Ray Index uses specific values to measure buying and selling pressure.
It compares recent price moves against an average to show strength or weakness.
Bull Power
Bull Power shows how much buyers push prices above a moving average.
Traders calculate it by subtracting the 13-day Exponential Moving Average (EMA) from the highest price during a trading period.
If Bull Power is positive, buyers are strong enough to push prices above the average.
If it turns negative, buyers are losing their grip.
Traders keep an eye on Bull Power to spot rising demand and possible price bumps.
It shows when bulls are still active, even if the overall market isn’t trending up.
Bear Power
Bear Power measures selling pressure by comparing the lowest price against the same 13-day EMA.
It subtracts the lowest price in the period from the EMA.
A negative Bear Power value means sellers have pushed prices below the average.
If Bear Power moves closer to zero or positive, selling pressure is fading.
Bear Power shows how much bears control the market and helps traders spot when a downtrend might slow or flip.
Exponential Moving Average (EMA)
The 13-day EMA smooths price data and gives more weight to recent prices.
This makes it react faster to current market shifts than a simple average.
EMA forms the base for both Bull and Bear Power calculations.
It sets the target price buyers and sellers try to beat.
By focusing on this average, the Elder Ray Index filters out small price noise.
It helps traders see clearer trends and real strength in buying or selling.
Calculation and Interpretation of the Elder Ray Index
The Elder Ray Index uses simple formulas to measure buying and selling pressure.
It looks at bull power, bear power, and a moving average to help traders figure out if the market is strong or weak.
You’ll usually see these values shown as a histogram, making trends pop out visually.
Calculation Formulas
The Elder Ray Index relies on three main components:
- Exponential Moving Average (EMA): Usually the 13-day EMA serves as the baseline.
- Bull Power: Highest price of the day minus the 13-day EMA.
- Bear Power: Lowest price of the day minus the 13-day EMA.
Here’s how you get the numbers:
- Bull Power = High Price – 13-day EMA
- Bear Power = Low Price – 13-day EMA
This shows how far prices move above or below the average, so you can see who’s stronger—buyers or sellers.
Interpreting Bull and Bear Power
Bull power shows buyer strength.
When bull power is positive and growing, buyers control the market and prices might rise.
If it turns negative, buying strength is fading.
Bear power shows seller strength.
Negative and falling bear power means sellers are strong and pushing prices down.
If bear power climbs toward zero or positive, selling pressure is easing up.
Traders watch these numbers separately to get a feel for market momentum.
Strong bull power alongside weak bear power suggests an upward trend.
The opposite means downward pressure.
Reading the Histogram
The histogram plots bull power and bear power values over time.
It helps traders spot changes in buying and selling strength fast.
- Bars above zero mean positive bull power.
- Bars below zero show negative bear power.
When bull power bars get taller, buying momentum is picking up.
When bear power bars sink lower, selling pressure is building.
A histogram that shrinks near zero could mean the trend is getting tired or about to reverse.
It’s a pretty clear visual for tracking the balance between bulls and bears while trading.
Trading Strategies and Signals Using the Elder Ray Index
The Elder Ray Index gives traders a way to spot market trends, compare price moves, and make clear trade decisions.
It helps identify strong trends, catch divergences that might signal reversals, and set up entry and exit points.
Trend Identification
The Elder Ray Index uses Bull Power and Bear Power.
Bull Power measures how high prices go above a moving average.
Bear Power shows how low prices fall below it.
When Bull Power is positive and rising, that’s a bullish trend.
Bear Power below zero and dropping signals a bearish trend.
Traders look for a clear gap between Bull and Bear Power to confirm the trend’s strength.
If both readings drift toward zero, momentum is fading and a trend change might be coming.
Traders can avoid jumping in during weak or iffy trends by watching these signals.
Strong Bull Power backs up buying opportunities, while strong Bear Power encourages short selling or just staying out of long trades.
Identifying Divergence
Divergence pops up when price moves one way, but the Elder Ray Index moves another.
A bullish divergence happens when prices hit new lows, but Bull Power or Bear Power climbs.
That can signal a possible reversal to the upside.
A bearish divergence shows prices making new highs, but Bull Power or Bear Power drops, hinting at a possible move down.
Divergences help traders spot fading trends before the price actually turns.
Traders use divergence as a heads-up.
It offers chances to prep for a reversal or tighten stops.
Divergences paired with trend signals make the Elder Ray Index pretty handy for risk management.
Generating Entry and Exit Signals
Entry signals show up when Bull Power rises above zero, confirming buyer strength.
Traders often go long when this lines up with rising prices above the moving average.
If Bear Power falls below zero, that can trigger an exit or a short position.
Exiting long trades also makes sense if Bull Power starts dropping while Bear Power climbs.
That shift means bears are taking control.
Stop losses usually sit just beyond recent highs or lows spotted by the index.
Using the Elder Ray Index with other tools like volume or moving averages boosts signal reliability.
The index marks when to enter or go short based on power strength, making it quite practical for day trading.
Best Practices for Day Traders
Day traders need to use the Elder Ray Index wisely to improve their decisions.
Combining it with other tools and dodging common mistakes helps you stay sharp in fast markets.
Combining with Other Technical Tools
The Elder Ray Index works best when you pair it with other technical analysis indicators like moving averages or the Relative Strength Index (RSI).
These tools confirm buy or sell signals and cut down on false entries.
Traders often use chart patterns with the Elder Ray Index to spot trends or reversals.
If you see a bullish Elder Ray reading with a breakout pattern, that’s a stronger case for a long trade.
Volume indicators add another layer by showing if price moves have real market support.
This combo helps traders read market strength or weakness before pulling the trigger.
Avoiding Common Pitfalls
One big mistake is relying only on the Elder Ray Index without any confirmation.
It can throw out misleading signals in choppy or sideways markets where trends are weak.
Traders should avoid overtrading on every signal.
Combining the Elder Ray Index with strong chart patterns and other indicators keeps you from making impulsive trades.
Skipping risk management is another trap.
Even with good signals, traders need to set stop losses and manage position sizes to protect against sudden market swings.
Applications and Limitations in Financial Markets
Traders use the Elder Ray Index to spot buying and selling pressure in financial markets.
It shines under certain conditions but definitely has its limits.
Suitable Market Conditions
The Elder Ray Index works well in markets that show clear trends.
It helps traders see if bulls or bears control the price.
You’ll find it useful in stocks, commodities, and forex—especially when prices move steadily up or down.
It’s most effective in moderately volatile markets where price swings are regular but not wild.
This balance lets traders use the index to time entries and exits with more confidence.
The index gives clearer signals during trending phases.
If you try it in quiet or range-bound markets, you might get confusing or flat-out false signals.
Limitations and Drawbacks
The Elder Ray Index really struggles when markets get volatile or just move sideways. All that price noise tends to throw out confusing signals, so you might end up making some questionable trades.
It doesn’t do a great job at spotting trend reversals, either. If you rely on it by itself, you might miss those early hints that something’s shifting—or worse, hang onto trades for way too long.
You need to back it up with other tools. If you skip volume analysis or ignore other trend indicators, you’ll probably miss out on the full picture.
When markets move fast, the Elder Ray Index tends to lag behind. So, use it with caution, and definitely pair it with other strategies if you want better results.