

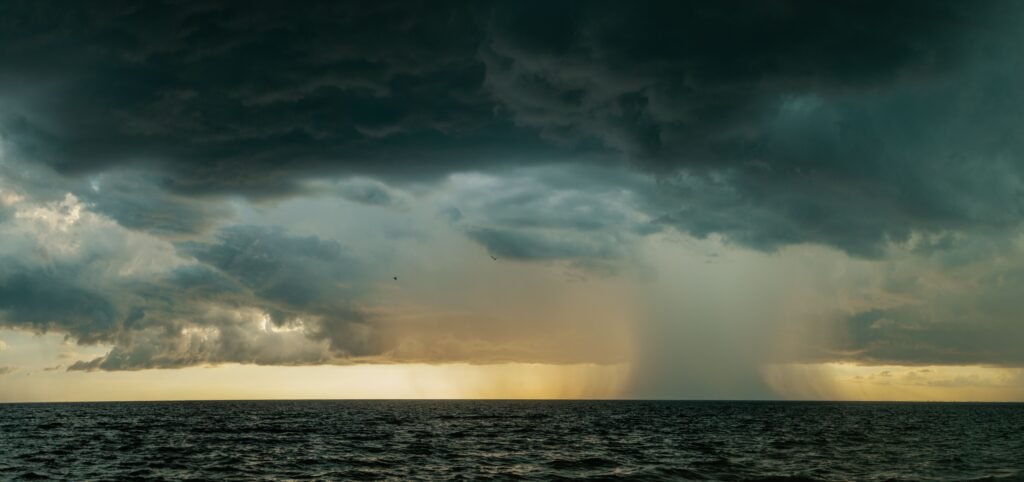
Professor Adam Scaife runs long-range forecasting at the UK Met Office. His job is to look at ensemble model output every month and describe it in measured language, because measured language is what long-range forecasting requires. Overstate a signal once and nobody trusts the next twenty forecasts.
So it is worth sitting with what he actually said about the El Niño now developing in the Pacific: “We should be clear that this is an unprecedented event. I have never seen an El Niño signal this intense in our forecasts.”
That is not a sentence forecasters hand out casually.
The short version
- What is happening: sea surface temperatures in the central and eastern equatorial Pacific are running well above average
- How big: forecasters expect Super El Niño status around October 2026, with peak intensity in late fall or early winter
- The odds: NOAA’s Climate Prediction Center has put the chance of a very strong event through October to December at 81%
- Record territory: roughly a 70% probability of the most severe event in a record that goes back to 1950
- Wetter and cooler: the Gulf States, the Southeast, and coastal California
- Warmer and drier: the northern tier, much of the West, and parts of the East
- The peak for rain: January through March 2027, not this fall
What the models are actually saying
El Niño forecasts get reported as single numbers, which hides the most useful thing about them: they move, and the direction they move tells you as much as the value itself.
| When | Who | The call |
|---|---|---|
| Earlier in 2026 | NOAA | El Niño conditions confirmed. 63% chance of a very strong event for November to January. |
| More recently | NOAA Climate Prediction Center | 81% chance of a very strong event for October to December. |
| Current | NOAA | Around 70% probability this becomes the most severe event since 1950. |
| Current | UK Met Office | “Strongest in living memory.” Signal intensity beyond anything in their forecast history. |
The confidence went up and the window moved earlier. Both of those are consistent with an event that is strengthening faster than the models initially expected, which is exactly the scenario that produces a record.
It is worth being precise about one thing. “Strongest on record” here means strongest in the instrumental record that begins in 1950. It does not mean strongest ever. Bigger El Niño events have almost certainly happened. We just were not measuring the Pacific with buoys and satellites when they did.
Who gets what
El Niño works by shifting where the atmosphere dumps its energy. Warm water in the eastern Pacific moves the region of heavy tropical convection east, which drags the subtropical jet stream with it. That jet is the delivery mechanism for winter storms across the southern United States, and when it strengthens and shifts south, the consequences fall out fairly predictably.
In plain terms, if you live along the Gulf Coast or across the Southeast, the expectation is a wetter and cooler winter than you are used to, with the heaviest part arriving after New Year. Texas, Mississippi, Alabama, Tennessee, and Georgia all sit inside the zone where forecasters have the most confidence.
If you live across the northern states, the expectation runs the other way: milder than normal, with the Midwest also trending dry. That sounds pleasant until you remember that a warm, dry winter in the upper Midwest means a thin snowpack, and thin snowpack means water supply problems the following summer.
Coastal California is the one to watch for damage rather than inconvenience. A strengthened subtropical jet aimed at California is the classic setup for atmospheric river events, and the signal there peaks January through March rather than this fall. Wet ground plus burn scars plus repeated storms is how you get debris flows.
Why forecasters are nervous about this specific one
The part that makes historical comparison hard
A strong El Niño raises global average temperature on top of whatever the baseline already is. Previous record events landed on a cooler planet. This one arrives on a baseline that has been rising steadily, so the same El Niño magnitude produces higher absolute temperatures than it would have in 1982 or 1997. The event is not unprecedented because the ocean is behaving in a new way. It is unprecedented because of what it is added to.
This is where a lot of coverage goes wrong in both directions. Some outlets treat El Niño as proof of climate collapse, which it is not, since El Niño is a natural oscillation that has run for thousands of years. Others treat it as a natural cycle and therefore nothing to do with warming, which is equally wrong, because the impacts scale with the baseline it sits on.
The careful version is duller and more accurate: a natural cycle, arriving on an altered background, producing consequences the natural cycle alone would not produce. That distinction between what a study says and what a headline says is the same one we walked through with the “Hothouse Earth” research that did not actually claim the planet is becoming uninhabitable.
The 1877 comparison, and its limits
You will see 1877 mentioned a lot in the coming months. That El Niño disrupted rainfall across India, China, Brazil, and parts of Africa simultaneously. Crops failed, rivers dried, and the resulting famines killed somewhere between 30 and 60 million people, making it one of the deadliest climate disasters ever recorded.
It is a legitimate reference point for the physical scale of what a large El Niño can do to global rainfall. It is a poor reference point for what happens next, and the reason matters. The 1877 death toll was produced by the interaction of drought with colonial administration, grain export policy, and the near-total absence of forecasting. Nobody saw it coming, and the food systems had no slack in them.
We now have monitoring buoys across the equatorial Pacific, satellites measuring sea surface temperature continuously, ensemble models producing seasonal outlooks months ahead, and global grain markets that can move supply. That is the actual difference between then and now, and it is a large one. The physical event might be comparable. The consequences should not be.
Forecasting infrastructure is the quiet hero of this story, and it is easy to forget how recently it arrived. The same orbital instruments that track ocean temperature are the ones that let researchers do things like spot individual mega-leaks of greenhouse gas from space, a capability that simply did not exist a generation ago.
What the forecast still cannot tell you
- Any specific storm. A seasonal outlook shifts the odds across three months. It says nothing about whether it rains on a given weekend in February.
- Exact peak timing. Late fall or early winter is the current expectation, and that window has already moved once.
- Whether the record actually falls. Roughly 70% is high, and it is not certain. Around three in ten of these forecasts do not land.
- How the atmosphere responds. Ocean temperature is the driver, but the atmospheric response can be weaker or messier than the ocean signal implies. Strong El Niño events have underdelivered on land before.
- Local effects. Regional signals hide enormous internal variation. “The Southeast is wetter” covers places that flood and places that barely notice.
What is worth doing now
If you are in the Gulf States, the Southeast, or coastal California, the useful window is the next couple of months, before the wet signal peaks after New Year. Check whether your flood risk designation has changed, since maps have been redrawn in a lot of counties recently, and understand that standard homeowners policies do not cover flood and that flood policies typically carry a 30-day waiting period. Buying in January is buying too late.
If you are in the northern tier or the Midwest, the thing to watch is not winter but next summer. A mild, dry winter reads as a gift right up until the snowpack numbers come in and the water restrictions start.
And for coastal ecosystems, a big El Niño is a genuine stress test. Warm water events push marine species out of their usual ranges and hit shellfish particularly hard, which is part of why restoration projects like Florida’s effort to put restaurant oyster shells back into the Gulf get judged over decades rather than seasons.
The forecast is unusually confident by the standards of a field that is usually careful to hedge. That is the signal worth paying attention to, more than any single percentage.
About this article: GeekBlog covers U.S. technology news, AI, phones, smartwatches and gaming. Every story is written and checked under our Editorial Policy. Spotted a mistake or have a story tip? Contact our editors.
