

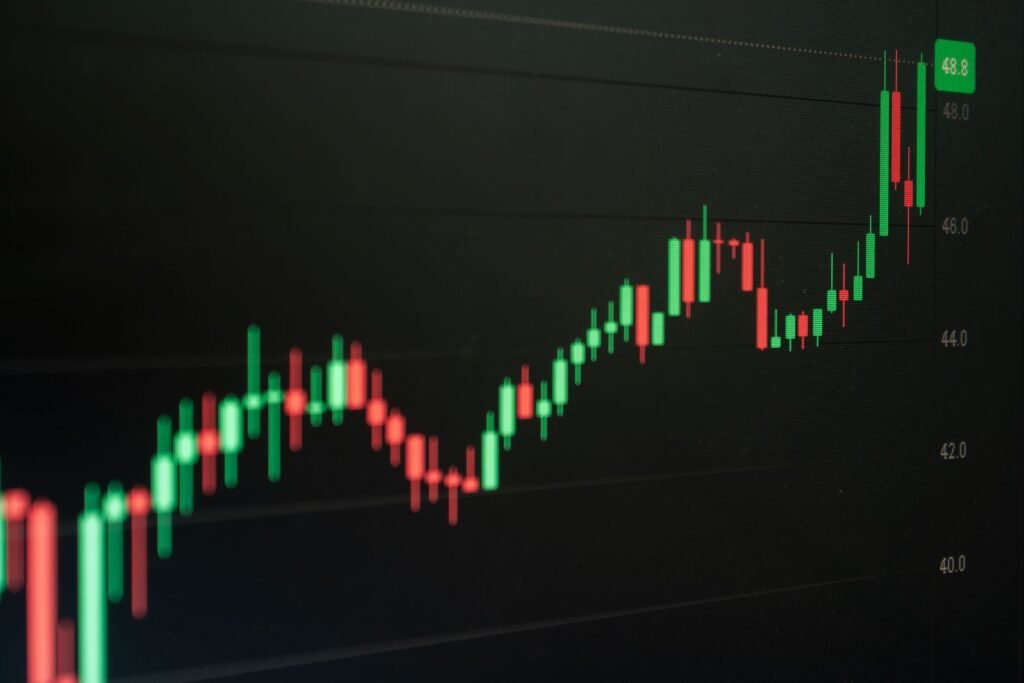
On Balance Volume (OBV) is used in scalping as a confirmation tool: you take a trade on price structure or VWAP, and you only take it when OBV is moving in the same direction, or when OBV is diverging against a price extreme you intend to fade. OBV on its own generates far too many signals on a one minute chart to be a trading system, but as a filter it answers the one question scalpers care about most, which is whether real volume is behind the move you are about to join.
Before going further, one caveat that belongs at the top rather than the bottom: the academic evidence that technical indicators produce consistent excess returns is weak, and this article is not investment advice. The section near the end explains what the research actually says. If you are new to reading price at all, start with the basics of candlestick patterns and come back.
The OBV formula
Joseph Granville introduced OBV in the 1960s and the calculation has not changed. For each bar:
- If today’s close is above yesterday’s close: OBV = previous OBV + today’s volume
- If today’s close is below yesterday’s close: OBV = previous OBV minus today’s volume
- If the close is unchanged: OBV = previous OBV
The absolute value of the line is meaningless; the starting point is arbitrary. What matters is its slope and whether it confirms or contradicts the shape of price. Here is the calculation in Python using pandas, which is handy for backtesting on downloaded one minute bars:
import numpy as np
import pandas as pd

def obv(df: pd.DataFrame) -> pd.Series:
    # df needs 'close' and 'volume' columns, one row per bar
    direction = np.sign(df["close"].diff()).fillna(0)
    return (direction * df["volume"]).cumsum()

def vwap(df: pd.DataFrame) -> pd.Series:
    # reset at each session; assumes a 'session' column (date)
    tp = (df["high"] + df["low"] + df["close"]) / 3
    pv = (tp * df["volume"]).groupby(df["session"]).cumsum()
    v = df["volume"].groupby(df["session"]).cumsum()
    return pv / v

bars["obv"] = obv(bars)
bars["vwap"] = vwap(bars)
bars["obv_ema"] = bars["obv"].ewm(span=20).mean()
The same thing in TradingView is one line, ta.obv, and every retail platform ships it as a stock study. The EMA of OBV in the last line is worth adding: on a one minute chart the raw OBV line is jagged, and a 20 period EMA on the indicator gives you a clean slope to compare against.
Why volume confirmation matters on 1 to 5 minute charts
On intraday timeframes, a large share of price movement is noise: a single block order, a stop run, or a market maker adjusting quotes can move a stock several ticks with almost no participation. Those moves tend to reverse. A move that comes with sustained volume, by contrast, reflects many participants agreeing, and it is more likely to continue long enough to pay a scalper’s spread and commissions.
Reading OBV in a scalp: the three states
| Price | OBV | Reading | Scalping use |
|---|---|---|---|
| New high | New high | Confirmed trend | Buy pullbacks to VWAP or a short EMA |
| New high | Lower high | Bearish divergence | Do not chase; look to fade on a reversal bar |
| New low | Higher low | Bullish divergence | Do not chase; look to buy a reclaim of VWAP |
| Sideways | Rising or falling | Accumulation or distribution | Prepare for a breakout in OBV’s direction |
| Sideways | Flat | No information | Stay out |
Divergence setups that work on short timeframes
Two rules keep divergence honest on a scalping chart.
Rule one: divergence is a condition, not an entry. Price making a higher high while OBV makes a lower high tells you the move is tired. It does not tell you when it turns. You still need a trigger: a bearish engulfing bar, a failed retest of the high, or a close back below VWAP.
Rule two: compare swing to swing, not bar to bar. On a one minute chart, OBV will disagree with price on individual bars constantly. A meaningful divergence spans at least two clear swing points, typically five to fifteen bars apart on a one minute chart or three to eight bars on a five minute chart.
A practical variant is the OBV trendline break. Draw a trendline under rising OBV swing lows. When OBV closes below that line before price breaks its own trendline, you have an early warning, and the price trendline break a few bars later is the entry.
Combining OBV with VWAP
VWAP is the session’s volume weighted average price and, for intraday traders, the most widely watched single reference line. OBV and VWAP pair well because they measure related things from different angles: VWAP tells you where the average participant is positioned, OBV tells you which side has been adding volume recently.
A simple framework for a long scalp:
- Price is above VWAP and VWAP is sloping up (session bias is long).
- OBV is above its 20 period EMA and made a new session high on the last push (volume agrees).
- Price pulls back to VWAP or to a rising 9 EMA on declining volume, and OBV holds above its prior swing low (no distribution during the pullback).
- Entry on the first bar that closes back above the 9 EMA; stop one to two ticks below the pullback low; first target the prior high.
Flip every condition for a short. The point of step three is the part most people skip: if OBV breaks its prior swing low during a pullback, the pullback is not a pullback, it is the start of distribution, and the trade is off.
For a different view of the same money flow question, Chaikin Money Flow weights volume by where the close sits within the bar’s range rather than by close to close direction, and many traders run both side by side, and the Elder Ray index adds a third view of buying and selling pressure.
False signals and how to reduce them
OBV has three well known failure modes on intraday charts.
The opening print. The first one minute bar of a US equity session often carries a large fraction of the day’s volume. Many scalpers reset OBV at the session open (the pandas code above is easy to adapt by grouping the cumulative sum by session) or simply ignore OBV divergences before 10:00 Eastern.
Doji and small range bars. OBV assigns the full bar’s volume to one direction even when the close moved one tick. A bar with heavy volume that closes a cent above the prior close is counted as pure buying.
Thin or halted names. In a stock that trades a few hundred shares a minute, one order dominates the volume and OBV becomes a record of a single participant. Restrict OBV scalping to liquid instruments: large cap equities, index ETFs, index futures, and major currency pairs (using tick volume, which is a proxy rather than true volume).
Position sizing and exits for OBV scalps
Scalping lives or dies on execution costs, so sizing should be mechanical. Decide on a fixed fraction of the account to risk per trade (many traders use a fraction of one percent for scalps because of the trade frequency), measure the distance from entry to stop in ticks, and divide.
For exits, OBV can help you hold a winner longer than a fixed target would. As long as each new price high is matched by a new OBV high, the trend is being fed by volume and there is no reason to exit on the first pause. When a price high arrives without an OBV high, take at least partial profit. A trailing stop such as the Chandelier Exit works well as the backstop on the remainder, although its default lookback needs to be shortened considerably for one minute bars.
What the evidence says about indicator profitability
It would be dishonest to present OBV, or any indicator, as a proven source of returns. The most cited academic review of the subject is Park and Irwin’s 2007 survey in the Journal of Economic Surveys, “What Do We Know About the Profitability of Technical Analysis?” They reviewed 95 modern studies and found that 56 reported positive results, 20 reported negative results, and 19 were mixed, but they also concluded that most of the positive studies suffered from data snooping, after the fact selection of trading rules, and inadequate handling of risk and transaction costs, and that conclusive evidence of profitability was still lacking.
For a scalper, transaction costs are the whole story. A filter that improves your win rate by a few points can still lose money if the spread and commissions exceed the average winner. Treat OBV as a way to skip bad trades, back test it on your own instrument and timeframe with realistic costs, and keep expectations modest. Nothing in this article is investment advice, and trading short timeframes with leverage can lose more than your initial deposit.
Troubleshooting
OBV looks completely different on two platforms
The starting value is arbitrary, so the level will always differ, but the shape should match. If the shape differs, one platform is probably using a different volume source (consolidated tape versus a single exchange) or a different session definition (including premarket or not). Check the data settings before trusting either.
OBV divergences keep failing
Most often the divergence was measured bar to bar rather than swing to swing, or it occurred in the first 30 minutes of the session when the opening print dominates the line. Require two clear swing points and skip the open. Also check that you are waiting for a price trigger rather than entering on the divergence alone.
OBV rises while price falls all day
This happens in instruments where the heaviest volume bars close marginally up (for example, a stock being sold steadily but with buy program prints at the close of each minute). It is a known weakness of close to close accounting. Switch to Chaikin Money Flow or Accumulation/Distribution, which weight by intrabar close location, and see if the picture agrees.
Frequently asked questions
Is OBV better than volume bars for scalping?
Not better, different. Volume bars show how much traded on each bar; OBV shows the running net of up volume minus down volume, which makes trends and divergences visible at a glance. Most scalpers keep raw volume bars on the chart and add OBV in a separate pane for the cumulative view.
What timeframe should OBV be set to?
OBV is calculated on whatever chart it sits on. For scalping, most traders read it on the one or two minute chart they trade from and glance at the five minute version for the broader session picture. There is no separate period setting on the indicator itself, only on any smoothing you apply.
Should OBV reset each session?
For intraday work, many traders prefer a session reset so the opening print does not dominate the line for hours. Standard platform implementations do not reset; you can approximate a reset by only comparing OBV swing points formed after the open, or by coding a session anchored version as shown in the Python example.
Can OBV be used as a standalone strategy?
Not sensibly on short timeframes. OBV crossovers and trendline breaks fire far too often on one minute bars to survive transaction costs. Its value for scalping is as a filter that removes low participation breakouts and flags exhausted moves, layered over a price based entry method.
The bottom line
OBV turns volume into a line you can compare to price with a glance. Used as a confirmation filter alongside VWAP and a clear price trigger, it helps you skip breakouts that nobody is participating in and hold winners that are still being fed.
Keep the caveats in view. Reset or ignore it around the open, read divergences swing to swing, restrict it to liquid instruments, and remember that the published research finds no conclusive evidence that indicators alone beat costs. Test it on your own data before risking money, and treat everything here as education rather than advice.
